Apr
Put This Elite Group of Dividend Stocks on Your Radar
The best thing about these elite dividend stocks is that there are no special hoops to jump through…
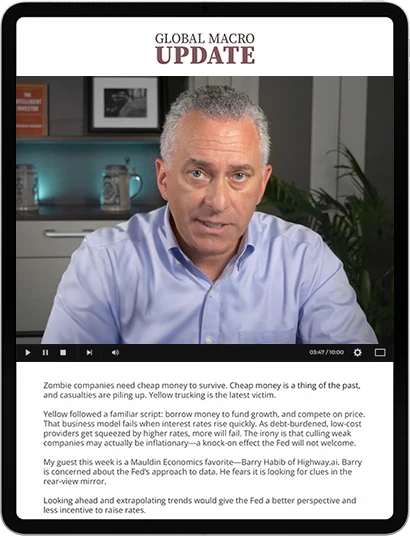
Read more..Get started now with Global Macro Update featuring Ed D’Agostino. Clear, concise, actionable research you can rely on.


From the Financial Crisis of 2008, to the Covid crash and subsequent run up, rampant inflation, geopolitical turmoil... the decade-long run of the FAANG trade, and more…
Mauldin Economics has served self-directed investors with institutional grade research you can rely on to make smarter, more timely portfolio decisions and grow your wealth responsibly over time.

Ed D’Agostino
Publisher & COO
Click on the video above to play.
We deliver the insight, analysis, and context you need to invest smarter for the long haul.
Diligently researched macro perspective - the what and why moving markets
Sector specific guidance on the biggest current opportunities
Education, tools, and resources you can use to generate better returns
Ongoing support and guidance to help you achieve your goals


The best thing about these elite dividend stocks is that there are no special hoops to jump through…
Read more..Today, we look at the world of “alternative investing.” I put it in quotes because this was originally…
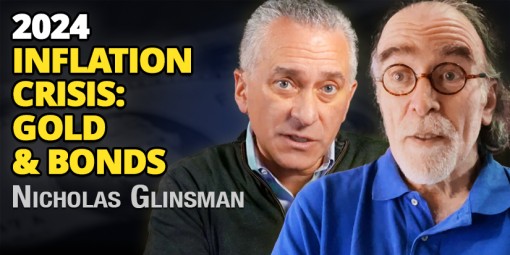
Read more..Gold has continued to reach new highs since I wrote about it a couple of weeks ago. Demand…
Read more..It’s earnings season… again. It always feels like we just finished reviewing the earnings from companies that report…
Read more..Have you seen the price of natural gas lately?
Read more..This is a huge opportunity for investors…
Read more...The research you receive from Mauldin Economics is
100% unbiased and independent.We promise to deliver you unique, well thought out perspectives on the macro landscape and individual opportunities with an absolute minimum of distraction.
The single most important metric for our business is your satisfaction.
Every Friday, Ed D'Agostino—our publisher and COO—interviews leading economic, geopolitical, and investment experts to help you get ahead of major trends and market shifts.